 The
standing of an oil company in a stock market depends on the size of its
"bookable" reserves and, because of past disputations, annual
reports now contain lengthy descriptions of internal evaluation
processes and "due diligence". The most sensitive issue is
whether the "booked" reserves, which decline as oil and
gas is extracted, are augmented by new additions. The key factor in
analysing the future viability of a company is the replacement ratio of
newly "booked" additional reserves to the production extracted
over the same period.
In the interests of the shareholders the financial authorities demand a knowledge of the "unknown" and have established a methodology for determining what is "known" about the "unknown". Moreover they penalise those that overstate the "unknown", insisting that the size of the "unknown" is "proven" or "known".
ignotum per ignotius = Explanation obscurer than the thing it is meant to explain; or, the unknown by the still less known (The Concise Oxford Dictionary); or, refer to Donald Rumsfeld :
The Unknown
As we know,
There are known knowns.
There are things we know we know.
We also know
There are known unknowns.
That is to say
We know there are some things
We do not know.
But there are also unknown unknowns,
The ones we don't know
We don't know.
—Feb. 12, 2002, Department of Defense news briefing
or, to BP's  in 2005, Lord Browne of Madingley
“One will never know how much (oil) there is … (source )
or, the BP Statistical Review of World Energy 2004
"Nobody knows or can know how much oil exists under the earth's surface or how much it will be possible to produce in the future"
Oil Majors' Annual Reports (ExxonMobil , BP , Shell, Total , Chevron )
Although considered difficult to assess, nevertheless the UK and the US have accounting rules for estimates of "proven" reserves for oil and gas. In the case of the UK there is a "Statement of Recommended Practice" (SORP) in 'Accounting for oil, gas, exploration and development, production and decommissioning activities' (UK SORP). In the USA the Securities and Exchange Commission (SEC) applies slightly different criteria, so a company like BP which operates in both countries has to express its reserves in accordance with both methods.
The figures in the annual reports are the summation of the figures for proven developed and undeveloped reserves. The principles of both the SORP and the SEC rules for the determination of the size of reserves are basically similar, differing mainly in the assessment of geological, geophysical and engineering data, which has "to demonstrate with reasonable certainty that the reserves can be recovered in future years under existing economic and operating conditions, that is, prices and costs are as at the date the estimate was made". See SORP, 12 (a)(ii)(b).
SEC regulations require that reserves are proven by drilling which is expensive in ultra deepwater and it is objected that seismic imaging technology has improved sufficiently to make this unnecessary.
The standing of an oil company in a stock market depends on the size of its "bookable" reserves and, because of past disputations, annual reports now contain lengthy descriptions of internal evaluation processes and "due diligence". The most sensitive issue is whether the "booked" reserves, which decline as oil and gas is extracted, are augmented by new additions. The key factor in analysing the future viability of a company is the replacement ratio of newly "booked" additional reserves to the production extracted over the same period.
In the interests of the shareholders the financial authorities demand a knowledge of the "unknown" and have established a methodology for determining what is "known" about the "unknown". Moreover they penalise those that overstate the "unknown", insisting that the size of the "unknown" is "proven" or "known".
Units
Units
|
In its 2005 Annual Report ExxonMobil claims to have added 1.7 Gboe to its proved reserves in 2005, while producing 1.5 Gboe of oil and gas in the same period. It claims in its text to have replaced 112% (129% excluding asset-sales) of its production, this being the 12th successive year that the company's proved reserves replacement has exceeded 100 percent. Over the five years 2001-2005 ExxonMobil added 2.8 Gboe to its resource base by a combination of exploration and acquisition. However, there is no clear split defined between the capital spent on exploration and that on acquisition. Out of a total upstream capital and exploration expenditure of $14.7 billion in 2005, $1.7 billion was spent on exploration, while $12.7 billion was spent on non-US production, out of which $4.4 billion was spent on "resource additions". (The upstream part of the industry finds and produces crude oil and gas.)
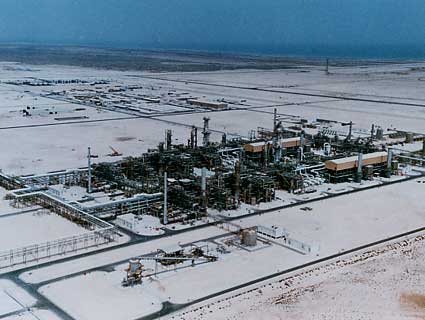
So in 2005 three times more was expended on acquisitions than exploration and the additions to the "booked" reserves were mainly due to acquisitions rather than from exploration. More capital was also presumably expended on facilities related to the acquisitions. For example, ExxonMobil is investing in the Qatar liquid natural gas (LNG) project which, as an established field, involves little risk of expenditure on a "dry well".

Oil majors shift from oil to gas
It appears that the "booked" gas reserves of the oil majors
are rising due to acquisitions and joint ventures, while their
"booked" oil reserves are declining. In order to check this
out and, if so, to assess the magnitude of the shift from oil to gas,
the 2005 annual reports of five major oil companies have been analysed
on a comparable basis and the findings coordinated in Table 1 Oil/Gas
replacement ratios.
|
Gb/Gboe |
Exxon/Mobil |
BP |
||
|
|
2005 |
2004 |
2005 |
2004 |
|
Reserves |
|
|
|
|
|
Oil reserves |
11.229 |
11.651 |
9.565 |
9.934 |
|
Replacement ratio % |
54 |
|
61 |
|
|
Gas reserves |
11.151 |
10.060 |
8.328 |
8.363 |
|
Replacement ratio % |
275 |
|
93 |
|
|
Total reserves |
22.380 |
21.711 |
17.893 |
18.297 |
|
Replacement ratio % |
143 |
|
72 |
|
|
Production |
|
|
|
|
|
Oil production |
0.917 |
0.935 |
0.935 |
0.924 |
|
Gas production |
0.622 |
0.656 |
0.530 |
0.535 |
|
Total production |
1.539 |
1.591 |
1.465 |
1.459 |
|
Reserves/Production |
|
|
|
|
|
Oil |
12.2 |
12.5 |
10.2 |
10.8 |
|
Gas |
17.9 |
15.3 |
15.7 |
15.6 |
|
All |
14.5 |
13.6 |
12.2 |
12.5 |
|
Gb/Gboe |
Shell |
Total |
||
|
|
2005 |
2004 |
2005 |
2004 |
|
Reserves |
|
|
|
|
|
Oil reserves |
4.636 |
4.888 |
6.592 |
7.003 |
|
Replacement ratio % |
65 |
|
31 |
|
|
Gas reserves |
6.830 |
6.994 |
4.514 |
4.145 |
|
Replacement ratio % |
68 |
|
217 |
|
|
Total reserves |
11.466 |
11.882 |
11.106 |
11.148 |
|
Replacement ratio % |
69 |
|
95 |
|
|
Production |
|
|
|
|
|
Oil production |
0.729 |
0.793 |
0.592 |
0.619 |
|
Gas production |
0.520 |
0.554 |
0.316 |
0.325 |
|
Total production |
1.249 |
1.347 |
0.908 |
0.944 |
|
Reserves/Production |
|
|
|
|
|
Oil |
6.4 |
6.2 |
11.1 |
11.3 |
|
Gas |
13.1 |
12.6 |
14.3 |
12.8 |
|
All |
9.2 |
8.8 |
12.2 |
11.8 |
|
Gb/Gboe |
Chevron |
All
5 |
||
|
|
2005 |
2004 |
2005 |
2004 |
|
Reserves |
|
|
|
|
|
Oil reserves |
8.000 |
7.973 |
40.798 |
41.449 |
|
Replacement ratio % |
104 |
|
62 |
|
|
Gas reserves |
3.906 |
3.279 |
34.716 |
32.841 |
|
Replacement ratio % |
302 |
|
182 |
|
|
Total reserves |
11.906 |
11.252 |
74.751 |
74.290 |
|
Replacement ratio % |
171 |
|
108 |
|
|
Production |
|
|
|
|
|
Oil production |
0.609 |
0.624 |
3.785 |
3.895 |
|
Gas production |
0.310 |
0.292 |
2.298 |
2.362 |
|
Total production |
0.919 |
0.916 |
6.080 |
6.257 |
|
Reserves/Production |
|
|
|
|
|
Oil |
13.1 |
12.8 |
10.6 |
10.6 |
|
Gas |
12.6 |
11.2 |
15.1 |
13.9 |
|
All |
13.0 |
12.3 |
12.3 |
11.9 |
Table 1 Oil/Gas replacement ratios.
The production quantity in 2005 is subtracted from the reserves at the end of 2004, and this figure is then compared with the reserves claimed at the end of 2005. The difference divided by the production (expressed as a percentage) then gives the replacement ratio. In the explanatory texts of the company reports the "booked" reserves are expressed as combined figures for oil and gas, using the oil equivalent volumes, allowing claims of an overall reserve replacement to be made, while obscuring the decline in the oil reserves.
This is particularly marked in the case of ExxonMobil, which as evident from Table 1 achieved an overall replacement ratio of 143% - enhanced by a gas replacement ratio of 275%, whereas that for oil alone is only 54%. Although the overall oil equivalent reserves have increased, its "booked" oil reserves have declined. (Confusingly in its report ExxonMobil gives three replacement ratios, of 112%, 129% and 143% in three categories.)
Although in the case of Chevron its oil reserves appear to have risen, the 2005 figure given is below that which it gives for 2003. There was a reserves 'blip' in 2004.
Shell's 55% stake in the Sakhalin 2 oil and LNG project represents 20% of its total "booked" reserves, showing the significance of the acquired reserves.
BP's "equity-accounted" reserves comprise 30% of its oil and 8% of its gas reserves. Its TNK-BP Russian acquisition procured around 80% of its "equity-accounted" reserves and provides BP with 35% of its total production.

When the figures for all five oil majors are combined (as in the last two columns of Table 1), the average oil reserves replacement of them is around 60%, while the replacement of gas reserves is around 180%, producing an overall oil equivalent replacement ratio of around 110%.
The oil equivalent of gas
Natural gas is converted by BP to its oil equivalent using 0.16 billion cubic metres (bcm) per million barrels of crude oil taking a Lower Heating Value (LHV) of 33 megajoules/cubic metre for natural gas and 5.7 gigajoules/barrel for oil. Put simply the oil equivalent of natural gas is based on their respective calorific values.
However, although both oil and natural gas suffer energy losses in their utilisation, the losses associated with natural gas are much greater. Crude oil can be transported without modification in very large tankships or by pipelines, the latter being subject to friction losses requiring pumping energy. Refining losses can vary between 5% and 10%, depending on the sulphur content of the crude oil, met by the respective energy contribution subtracted from that in the oil.
In the case of natural gas the energy losses depend on its remoteness from the market and whether it can be transmitted solely by pipeline or has to be liquefied for sea transport. The losses are encountered by the overland pipeline transmission from the gas field to the processing plant, by the purification prior to and by the liquefaction process and by the evaporation from the tankship storage vessels while at sea. The gas has to be purified of contaminants such as sulphur and carbon dioxide prior to liquefaction, which would otherwise inhibit the cryogenic process. The level of the energy loss is hard to elicit from published documents, perhaps because it is embarrassingly high, but could be between 15% to 40% of the original energy in the gas.

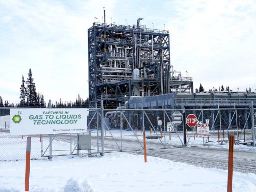
Another more significant loss occurs when the gas is used as a substitute source for liquid fuels and petrochemicals. BP conducted research on a pilot scale on a plant in Nikiski, near Anchorage in Alaska, which produced liquid fuels, such as petrol, diesel and jet fuel from gas piped from the North Slope. The Nikiski test facility was designed to produce 300 barrels/day of synthetic crude oil from 3 million cubic feet of natural gas. This assumed a practical thermal efficiency of its gas-to-liquid (GTL) process of around 55%. BP has declined to publish the actual results, which it claims were successful. The pilot plant is now to be devoted to the synthesis of petrochemical products.
The local Alaskan community hoped that a successful test of the pilot plant would result in the installation of a full-scale plant. BP has decided not to proceed, but has a joint venture with Atlas Methanex in a gas-to-products (GTP) plant in Trinidad in the Caribbean, producing methanol from natural gas.
Natural gas is now rated as an essential substitute for oil, whereas in the past it was flared off or re-injected into the wells. The poor conversion efficiency was therefore not of great concern and some 10 GTL and GTP production plants are in operation around the world, some located near the gas source, thereby limiting the energy losses prior to processing, so that liquid fuels can be transported by ship instead of LNG.
The conclusion from the above diversion into gas transmission and utilisation efficiencies is to show that to class natural gas as an oil equivalent reserve purely on the basis of a comparison of the respective calorific values is to overrate its reserve status. Depending on its remoteness from the market and its ultimate use its equivalent should be downgraded by at least 85%, perhaps to as low as 20% (if it emerges as synthetic crude oil at the end of a long pipeline, with LNG liquefaction and transport and then a GTL process).
The SORP and SEC rules for "booked" natural gas reserves are in need of revision. A set of oil equivalents could be tabulated related to the transmission and utilisation of the gas.
Peak oil and gas
The analysis of the oil majors' annual reports shows conclusively that oil production has passed its peak - the achieved reserve replacement ratios are inadequate to maintain the level of "booked" reserves. The low level of investment in exploration is an indication of the paucity of new locations from which it is forecast that oil can be economically extracted. Thus, the oil majors find that the acquisition of "known" oil and gas fields is preferable to looking for the "unknown".
The analysis of Table 1 does show however, that a natural gas production peak has not yet arrived as reserve replacement ratios are high. But progress towards peak gas will accelerate as the low overall utilisation efficiencies involved will mean that relatively more gas energy will be needed to substitute for oil-derived liquid fuels. Also the more remote and difficult of the "known" gas fields may yet prove to be uneconomic.
The "known" and the "unknown"
The presentation of combined oil and "oil equivalent" gas reserves in order to gauge an overall replacement ratio obscures the "known" depletion of economically-retrievable oil reserves.
The low utilisation efficiency of "stranded" or remotely-located natural gas is "known" but is seemingly "unknown" to the legislators who allow it to be rated as an "oil equivalent" on its calorific value alone.
The combined results of the five oil majors in their annual reports show that it is "known" that a peak in regular oil production is with us, but the method of presentation of replacement ratios indicates that they would rather it was "unknown".
ignotum per ignotius
